
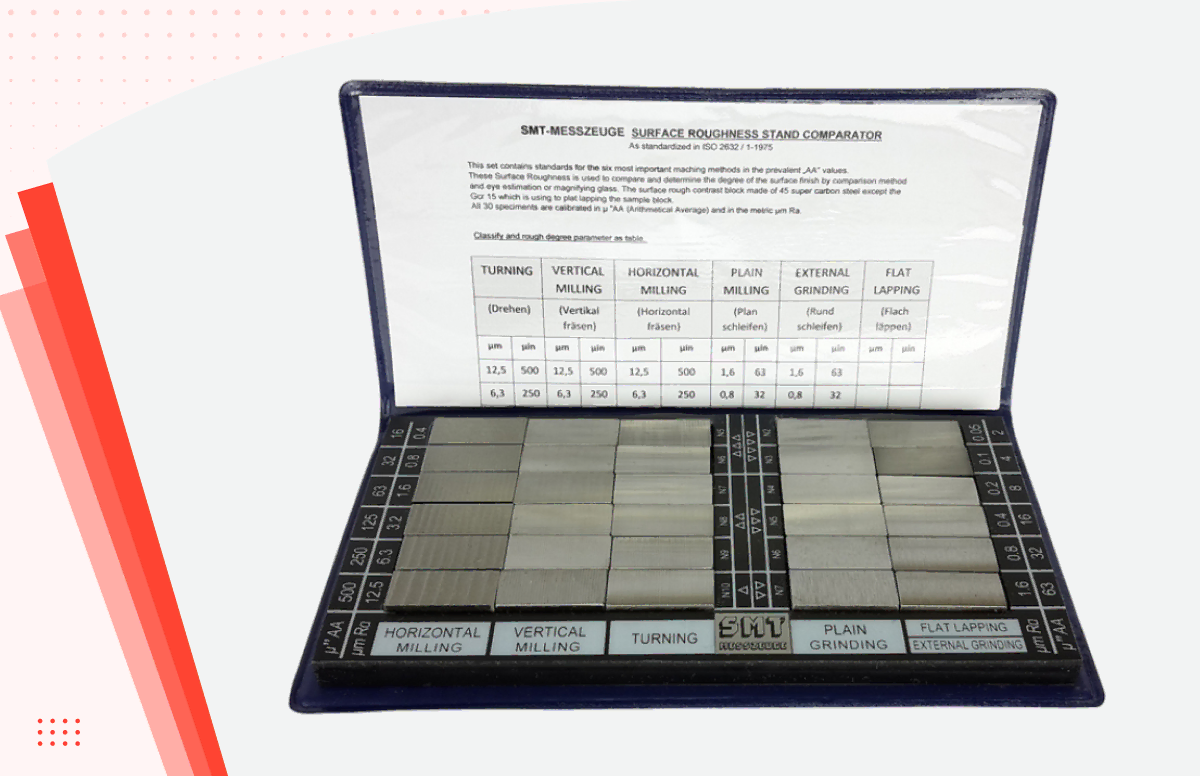
A surface finish chart is the reference that connects three things engineers usually keep separate: the roughness value on a drawing, the manufacturing process that can produce it, and the cost of asking for it. Read correctly, it tells you whether a callout is routine or expensive before the part is ever quoted.
This guide explains what the chart contains, how Ra and Rz differ, how to read the roughness symbol on a drawing, and which values each machining process realistically holds.
What a Surface Finish Chart Shows
A surface finish chart maps roughness values against the processes that produce them. Most versions include four columns:
- Roughness average (Ra) in micrometers and microinches
- Roughness grade number (N grade), running from N1 for mirror finishes to N12 for rough surfaces
- Typical production process, such as milling, turning, grinding, or lapping
- Common applications for that range
The chart’s real function is a sanity check. If a drawing calls for Ra 0.2 micrometers on a milled pocket, the chart shows immediately that milling alone cannot get there and a secondary process is required.
Understanding Ra, Rz, and the Other Parameters
Surface roughness is measured with a profilometer that drags a stylus across the surface and records the height variation. Different parameters summarize that profile in different ways.
Ra Surface Finish
Ra surface finish, the roughness average, is the arithmetic mean deviation of the profile from its centerline. It is the most widely used parameter worldwide, and it is stable and repeatable. Its weakness is that it averages, so a surface with occasional deep scratches can report the same Ra as a uniformly textured one.
Rz Surface Finish
Rz surface finish is the average of the largest peak-to-valley heights across several sampling lengths. Because it responds to extremes rather than averages, it catches the defects that Ra smooths over. Rz is commonly specified in Europe and on sealing and bearing surfaces where a single deep scratch matters.
A rough conversion used in practice is Rz equal to roughly four to seven times Ra, depending on the process. It is an approximation, not a substitute, so a drawing that specifies Rz should be inspected against Rz rather than converted.
Rmax and Rt
Two other parameters appear occasionally. Rmax records the single largest peak-to-valley height in the evaluation length. Rt records the total height from the highest peak to the lowest valley across the whole profile.
Surface Roughness Chart: Values, Grades, and Processes
The surface roughness chart below covers the range most machined parts fall into, with values in both micrometers and microinches.
| Ra (µm) | Ra (µin) | N grade | Typical processes | Common applications |
| 12.5 | 500 | N10 | Rough milling, sawing, flame cutting | Non-critical surfaces, weldments |
| 6.3 | 250 | N9 | Rough turning, milling, drilling | Clearance surfaces, unmachined faces |
| 3.2 | 125 | N8 | Standard milling and turning | General machined surfaces, brackets, housings |
| 1.6 | 63 | N7 | Finish milling and turning | Mating surfaces, light-load mechanisms |
| 0.8 | 32 | N6 | Fine turning, milling, reaming, grinding | Bearing seats, sealing faces, sliding fits |
| 0.4 | 16 | N5 | Grinding, honing | Hydraulic components, precision fits |
| 0.2 | 8 | N4 | Fine grinding, honing, polishing | Seal surfaces, high-pressure applications |
| 0.1 | 4 | N3 | Lapping, superfinishing | Gauge blocks, optical mounting surfaces |
| 0.05 | 2 | N2 | Lapping, polishing | Mirror finishes, optical components |
Ra 3.2 is the default as-machined condition on most CNC parts. Ra 1.6 is achievable with finishing passes and is the usual step before extra cost becomes noticeable. Anything below Ra 0.8 generally requires a secondary process such as grinding, honing, or lapping, and the price rises accordingly.
CNC Machining Surface Finish by Process
Each process has a natural range. Pushing below it is possible only with slower feeds, more passes, or a secondary operation.
| Process | Typical Ra range (µm) | Notes |
| Face and end milling | 0.8 to 6.3 | Finish passes and sharp tooling drive the lower end |
| Turning | 0.4 to 6.3 | Nose radius and feed rate dominate the result |
| Drilling | 1.6 to 6.3 | Reaming or boring improves the bore surface |
| Reaming | 0.8 to 3.2 | Common finishing step for holes |
| Boring | 0.4 to 3.2 | Better control than drilling on diameter and finish |
| Grinding | 0.1 to 1.6 | Standard route below Ra 0.8 |
| Honing | 0.05 to 0.8 | Cylinder bores and hydraulic components |
| Lapping | 0.012 to 0.2 | Highest precision, lowest throughput |
| Wire EDM | 0.4 to 3.2 | Multiple passes improve finish |
Several factors move the result within each range: cutting speed and feed rate, tool nose radius, tool wear, machine rigidity, coolant, and the material itself. Softer and more ductile materials such as aluminum and copper tend to tear rather than shear cleanly at low speeds, which is why finish improves with higher surface speed on those alloys. Shops running CNC machining with modern tooling and rigid setups hold the lower end of these ranges reliably, but the process limit still applies. CNC machining surface finish is decided by the process first and the operator second.
How to Read a Surface Finish Callout on a Drawing
The roughness symbol is a checkmark shape with additions that carry specific meaning.
- The basic symbol is a check with an extended leg. Alone, it indicates a surface requirement without specifying the method
- A horizontal bar added means material removal is required, in other words the surface must be machined
- A circle added means material removal is prohibited, so the surface stays as cast, forged, or molded
- The number above the symbol is the maximum roughness value, usually Ra in micrometers
- Two numbers indicate a range, with the maximum on top and the minimum below
- A note beside the symbol may specify the parameter (Ra, Rz), the sampling length, or the lay direction
- A circle at the symbol’s vertex applies the requirement to all surfaces of the part
Lay direction, shown by a symbol such as a parallel or perpendicular mark, specifies the direction of the tool marks. It matters on sealing faces and sliding surfaces, where tool mark direction affects leakage and wear behavior.
Matching Surface Finish to the Application
| Application | Typical requirement | Reason |
| Non-critical structural surfaces | Ra 3.2 to 6.3 | Appearance and fit are not affected |
| General mating faces | Ra 1.6 to 3.2 | Adequate contact without added cost |
| Static seal faces (O-rings) | Ra 0.8 to 1.6 | Seal needs a smooth, defect-free surface |
| Dynamic seal faces | Ra 0.4 to 0.8 | Reduces wear on the sealing element |
| Bearing journals | Ra 0.2 to 0.8 | Controls friction and oil film behavior |
| Hydraulic bores | Ra 0.2 to 0.4 | Prevents leakage and scoring |
| Cosmetic visible surfaces | Ra 0.8 to 1.6, often bead blasted | Uniform appearance matters more than the number |
| Optical and gauge surfaces | Ra 0.05 or below | Reflectivity and dimensional reference |
A useful rule when specifying: every step down the chart roughly increases finishing cost, and steps below Ra 0.8 frequently require adding an entire process. Specify the loosest finish the function allows.
How Finishing Processes Change the Result
Secondary processes change the surface after machining, sometimes in ways the drawing number does not capture.
- Bead blasting produces a uniform matte texture, typically Ra 0.8 to 1.6, hiding tool marks rather than reducing roughness in a measured sense
- Tumbling smooths edges and surfaces on small parts in bulk
- Polishing reaches Ra 0.4 or better, at significant labor cost on complex shapes
- Anodizing slightly increases measured roughness because the oxide layer grows outward
- Powder coating covers the machined texture entirely, so the pre-finish roughness matters only for adhesion
Because these processes change both appearance and measured value, the drawing should state whether the roughness requirement applies before or after finishing. Aligning the roughness callout with the intended surface finishing process prevents a part from being rejected for a value that the coating itself caused.
Measuring and Verifying Surface Finish
Measurement is done with a contact profilometer for most industrial work, or an optical instrument where the surface cannot be touched. Suppliers with a controlled metrology room produce more repeatable readings than shop-floor spot checks. Three practical points:
- The sampling length must match the standard, since a different cutoff produces a different number on the same surface
- Measurement direction should be perpendicular to the tool marks, which produces the highest and most meaningful reading
- Surface finish should be treated as an inspected characteristic on the quality inspection plan when it is functionally critical, not just noted on the drawing
Visual comparison against a surface roughness comparator plate is common for quick shop checks. It is useful for sorting, but it is not a substitute for a measured value when the requirement is tight.
Specifying Finish Without Overpaying
The most common costly mistake is applying a single tight roughness callout to the whole part when only one or two surfaces need it. Identify those surfaces, specify them individually, and leave the rest at the standard as-machined condition.
It also helps to state the finish in the same units the supplier works in, name the parameter explicitly rather than assuming Ra, and confirm that the chosen material can hold the value, since soft aluminum and gummy plastics behave differently from steel under the same tooling. Design teams unsure whether a callout is achievable in their chosen alloy can review the drawing with XC Machining before release.
FAQs
Q: What is the standard surface finish for CNC machined parts?
Ra 3.2 micrometers, or 125 microinches, is the standard as-machined condition. It requires no additional operations and suits most functional surfaces. Ra 1.6 is achievable with finishing passes at modest added cost, and tighter values usually need a secondary process.
Q: What is the difference between Ra and Rz?
Ra is the arithmetic average deviation of the surface profile, which smooths over occasional defects. Rz averages the largest peak-to-valley heights, so it captures isolated scratches. Rz is preferred on sealing and bearing surfaces where a single defect matters.
Q: Can Ra be converted to Rz?
Only approximately. Rz typically runs four to seven times Ra depending on the process, but the relationship is not fixed. If a drawing specifies Rz, the surface should be measured against Rz rather than converted from an Ra reading.
Q: Does a smoother surface finish cost more?
Yes, and the increase is not linear. Moving from Ra 3.2 to Ra 1.6 adds finishing passes. Going below Ra 0.8 usually requires grinding, honing, or lapping, which adds a separate operation, setup, and inspection step.
Q: How is surface finish measured?
Most commonly with a contact profilometer that drags a stylus across the surface perpendicular to the tool marks. Optical instruments are used on delicate surfaces. Comparator plates allow quick visual checks but are not accurate enough for tight requirements.